Self-Service Analytics Platform for Capital Markets & Specialty Finance
Access loan and portfolio information through natural language exploration, interactive dashboards, and customizable reporting, all within the Finley platform.
Finley Analytics gives capital markets and specialty finance teams direct access to portfolio information within Finley, bringing natural language exploration, dashboards, spreadsheets, reports, and SQL-based analysis together in a single workspace. Every user can work with the same underlying data through the interface that best fits their role and workflow.
Analytics Built for Portfolio Intelligence
Designed for Specialty Finance Workflows
Finley Analytics supports capital markets and specialty finance workflows with flexible tools designed for complex portfolios, investor reporting, and the teams responsible for portfolio oversight.
01
Centered on Portfolio Data
Connects users to the information needed for portfolio analysis, reporting, and oversight across capital markets and specialty finance.
02
Analytics for Every Team
Supports business, operations, and technical users with multiple ways to interact with the same underlying data, from natural language queries and visual analysis to spreadsheet workflows and advanced SQL capabilities.
03
Current by Design
Runs reports and dashboards against current data at the time of analysis, giving users timely visibility into portfolio performance and operational activity.
04
Part of the Finley Platform
Extends the Finley platform with advanced analytics capabilities that support broader credit administration workflows.
Finley Analytics Features
AI-Assisted Data Exploration
Explore portfolio information through natural language questions that help users quickly identify relevant data, trends, and insights.
Custom Dashboard Builder
Create and save dashboards with the metrics, visualizations, and views needed to monitor performance and support reporting.
SQL-Based Analysis
Give technical users direct access to underlying data for custom queries, analysis, and advanced reporting.
Spreadsheet-Style Analysis
Analyze portfolio information through familiar spreadsheet-style tools and formulas.
Reporting Workflows
Create repeatable reporting workflows with saved views, dashboards, and analytical outputs that support ongoing portfolio oversight.
Data Visualization
Visualize portfolio information through configurable charts, dashboards, and views designed for analysis and reporting.
Inside Finley Analytics
From natural language exploration and dashboard creation to advanced analysis and reporting, Finley Analytics brings multiple ways to interact with the same underlying data through one connected experience.
Explore Data Through Natural Language
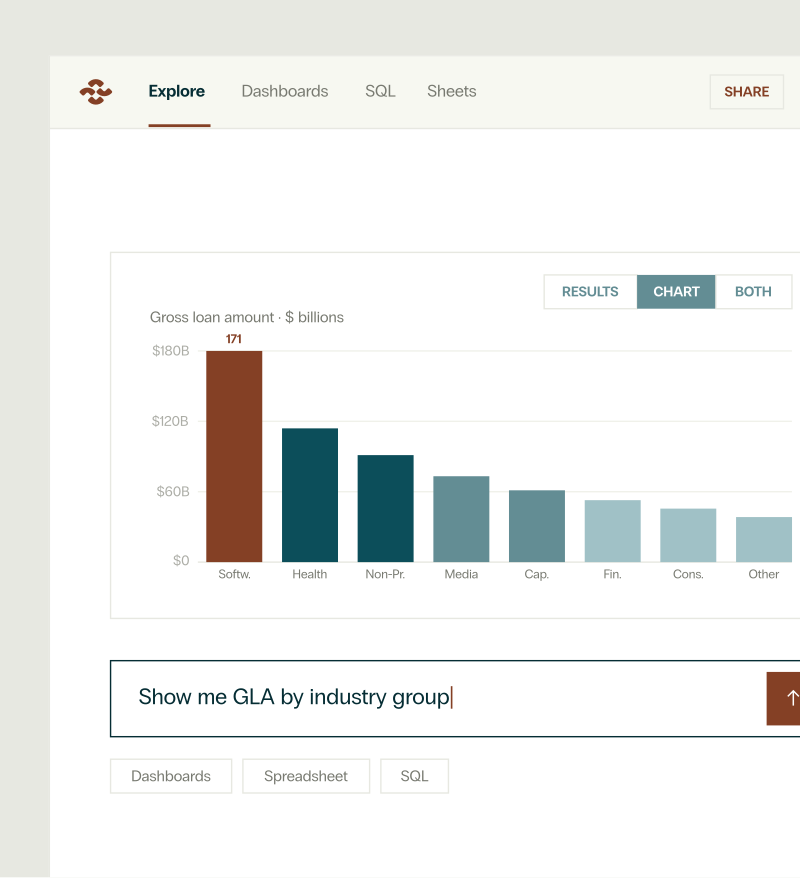
Finley Analytics allows users to explore data through natural language questions, then continue refining their analysis through dashboards, spreadsheets, or SQL using the same underlying information within Finley.
Ask questions using natural language prompts
Generate relevant data views and visualizations
Refine analysis through connected dashboards, spreadsheets, and SQL
Build Custom Dashboards
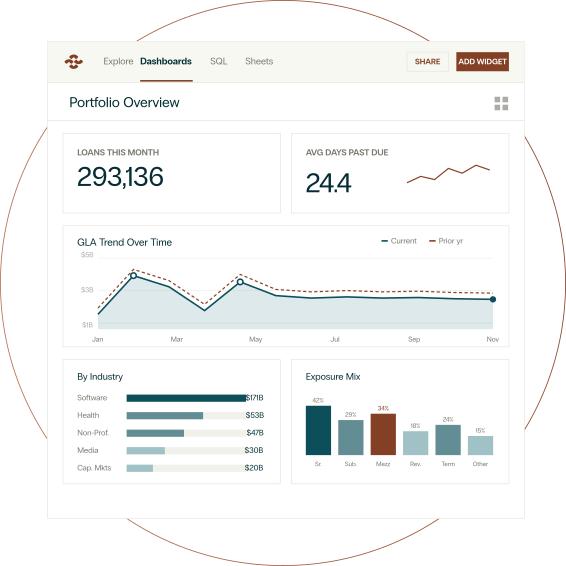
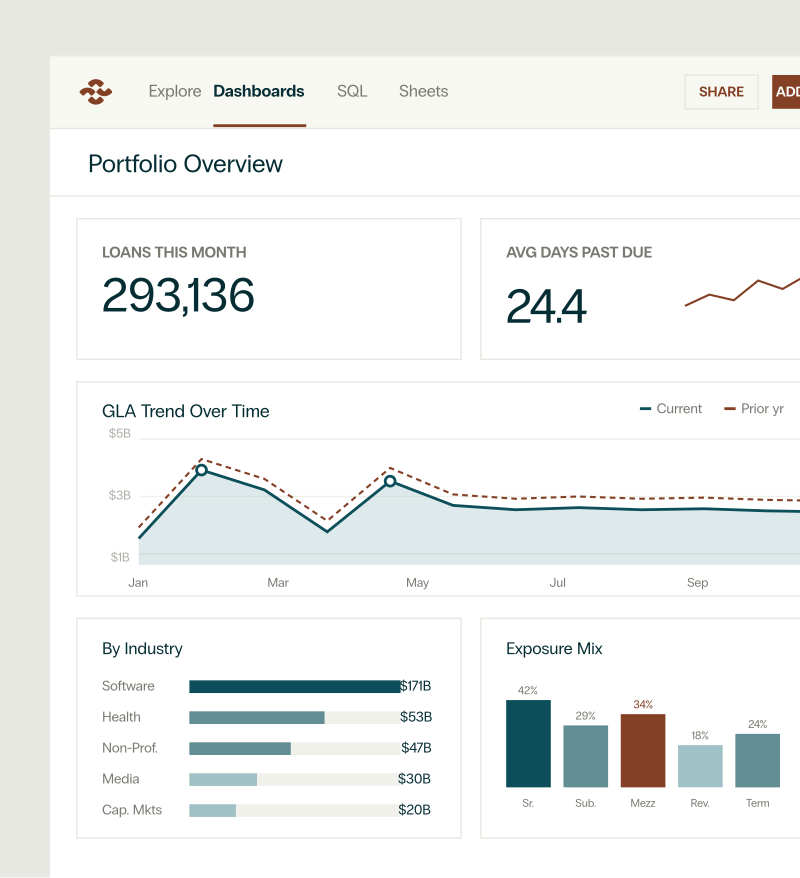
Finley Analytics enables users to create dashboards that organize portfolio information into reusable views for monitoring performance, supporting reporting, and sharing analysis across teams.
Create dashboards tailored to specific reporting needs
Configure metrics, charts, and portfolio views
Save reusable dashboards for ongoing analysis
Analyze Data at the SQL Level
Technical users can work directly with underlying data through SQL tools, creating custom queries and analysis within the Finley environment.
Write and execute custom SQL queries
Perform advanced portfolio analysis
Create custom analysis from detailed data structures
Spreadsheet-Style Analysis
Finley Analytics provides a familiar spreadsheet-style experience, allowing users to analyze current information using formulas and functions they already know.
Analyze data through familiar spreadsheet workflows
Apply formulas and calculations to portfolio information
Work with live data through a familiar interface
Built for Every Team Managing Credit Portfolios
Teams across capital markets and specialty finance rely on different views of portfolio performance. Finley Analytics provides flexible tools for analysis, reporting, and oversight across the roles responsible for managing complex credit portfolios.
Capital Markets Teams
Analyze portfolio performance and support reporting requirements with access to the information needed for oversight, analysis, and decision-making.
Business & Portfolio Users
Monitor performance, explore trends, and access the views needed to inform portfolio management.
Operations & Reporting Teams
Build repeatable reporting processes and manage operational information through configurable analytical workflows.
Data & Technical Users
Perform advanced analysis through custom queries and direct access to underlying data.
Connected to the Finley Platform
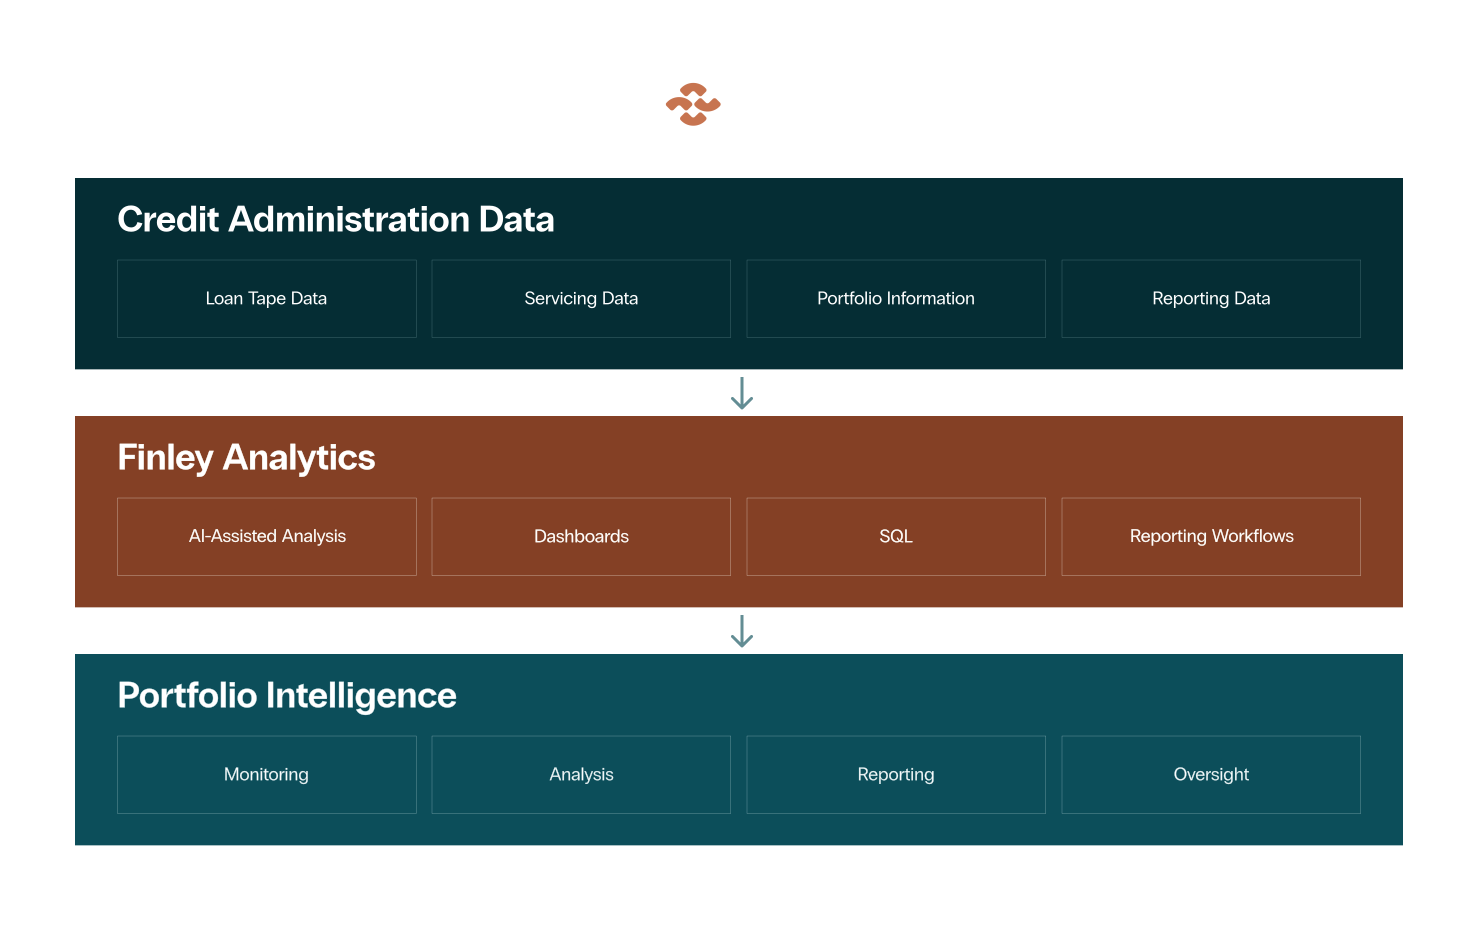
Built directly into the Finley platform, Finley Analytics connects credit administration data with the analytical tools teams use to explore portfolio information, manage reporting, and maintain portfolio visibility.
Analyze Portfolio Performance with Greater Control
Finley Analytics extends the Finley platform with advanced analytics capabilities that help capital markets and specialty finance teams transform portfolio information into operational insight, reporting, and decision support throughout the credit lifecycle.

.svg)